ar2009 23 / 44
10秒後にBOOKのページに移動します
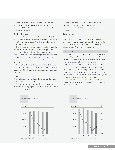
As a result, total sales for the Acrylic Products segment fell 18.8% year-on-year to \41,460 million. Operating income increased 2.3% to \1,411 million, due in part to lower costs at our subsidiary in Singapore. Specialty Chemicals Shipments of the general-use instant adhesive Aron Alpha held up throughout the year, but recovery in industrial adhesive sales in the Japanese market lagged. Overall, sales of adhesives were significantly down. Sales of the UV-curable resin Aronix increased on recovery in demand in electronic materials field and other applications. Sales of products developed in-house likewise declined steeply. Despite strong shipments of high purity industrial silicon gases, demand for inorganic ion-exchanger IXE products and silver-based inorganic antimicrobial agents Novaron was slow in recovering. As a result, total sales for the segment declined 6.4% year-onyear to \22,829 million. Operating income increased 10.4% yearon- year to \4,311 million on expanded sales of highly profitable products. Plastics Sales of plastic products for the nursing-care and welfare sectors increased, with steady shipments. Sales of pipes and couplings and elastomer compounds declined due to falling shipments, amid protracted weak demand with only slow recovery. Consequently, total sales in the Plastics segment declined 6.4% year-on-year to \28,599 million. Operating income meanwhile increased 37.9% to \1,791 million on cost-cutting measures. Other Businesses Sales for this segment, which comprises new product development operations, the construction and repair of plants and production facilities, and goods transportation services, posted a year-on-year increase of 2.5% to \1,497 million. However, an operating loss of \666 million was registered. Cash Flows Net cash provided by operating activities increased by \9,420 million to \22,701 million from the previous year. Positive factors included an increase in income before income taxes, as well as inventory cutbacks and lower income taxes paid. Net cash used in investing activities shrank by \2,602 million to \6,174 million year-on-year, due to reduced purchases of investments in securities, and repayments of loans receivable. Net cash used in financing activities increased \9,934 million year-on-year to \13,992 million, due to an increase in repayments of short-term bank loans and purchases of treasury stock. As a result of the above, cash and cash equivalents at the reporting term-end stood at \12,387 million, for an increase of \2,561 million over the previous term-end. 0 30,000 60,000 90,000 120,000 0.0 4.0 8.0 12.0 16.0 (Millions of yen) (%) 05 06 07 08 09 99501 103870 105339 99271 99449 13.3 6.8 6.1 1.9 3.6 Net worth & ROE Net worth (left scale) ROE (right scale) 0 50,000 100,000 150,000 200,000 0.0 2.0 4.0 6.0 8.0 (Millions of yen) (%) 05 06 07 08 09 186521 195607 182681 172464 161609 6.7 3.6 3.4 1 2.2 Total assets & ROA Total assets (left scale) ROA (right scale) Toagosei Co., Ltd. 21