ar2009 34 / 44
10秒後にBOOKのページに移動します
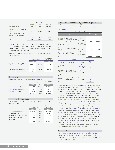
Millions of yen December 31, 2008 Acquisition cost Carrying value Unrealized gain (loss) Securities whose carrying value exceeds their acquisition cost: Stock......................................................... \3,314 \5,933 \2,618 Securities whose acquisition cost exceeds their carrying value: Stock......................................................... 4,530 3,460 (1,070) Total................................................................. \7,845 \9,393 \1,548 (c) Sales of securities classified as other securities amounted to \0 million (U.S.$7 thousand) with a gain of \0 million (U.S.$0 thousand) for the year ended December 31, 2009 and \205 million with a gain of \36 million for the year ended December 31, 2008. (d) Other securities without market value as of December 31, 2009 and 2008 were as follows: Millions of yen Thousands of U.S. dollars 2009 2008 2009 Investments in unconsolidated subsidiaries and affiliates: .................... \2,256 \2,348 $24,498 Other securities: Unlisted securities................................. 1,142 1,142 12,407 Other.............................................................. 383 446 4,163 5. Inventories Inventories at December 31, 2009 and 2008 were as follows: Millions of yen Thousands of U.S. dollars 2009 2008 2009 Merchandise and finished products.... \10,537 \13,966 $114,409 Work in process............................................. 591 578 6,419 Raw materials and supplies.................... 4,734 4,807 51,403 \15,862 \19,352 $172,232 6. Property, Plant and Equipment Property, plant and equipment at December 31, 2009 and 2008 were summarized as follows: Millions of yen Thousands of U.S. dollars 2009 2008 2009 Land...................................................................... \18,050 \18,006 $195,984 Buildings and structures.......................... 18,891 19,345 205,121 Machinery, equipment and other...... 21,756 25,550 236,230 Construction in progress......................... 1,358 2,223 14,746 Lease assets...................................................... 216 60 2,355 \60,273 \65,186 $654,438 7. Impairment Loss on Property, Plant and Equipment The Company and its consolidated subsidiaries have recognized impairment losses on the following classes of assets for the years ended December 31, 2009 and 2008: December 31, 2009 Location Major use Category Millions of yen Thousands of U.S. dollars Tokushima city, Tokushima Facilities for manufacturing chlorinated organic solvents Buildings, machinery and equipment \1,846 $20,050 Nagoya city Laboratory Buildings, machinery and equipment 443 4,814 Nagoya city and other Company housing Buildings and structures 143 1,560 Nagoya city Synthetic resin molded products Tools and long-term prepaid expenses 52 572 Total \2,486 $26,998 December 31, 2008 Location Major use Category Millions of yen Minato ward, Nagoya city Idle Buildings, machinery and equipment \269 Takaoka city, Toyama Acrylic polymer production facility Buildings, machinery and equipment 267 Mihara city, Hiroshima Idle Land and buildings 107 Singapore Acrylic acid ethyl ester production facility Machinery and equipment 29 Total \674 The Company and its consolidated subsidiaries have grouped business-use assets according to the minimum independent cash-flow-generating unit and have identified idle assets as one group for the purpose of accounting for impairment of property, plant and equipment on an individual basis. When there is a decrease in profitability, no specific plan for future use or the book value of such idle assets is less than their respective recoverable amounts, the book value of the assets is written down to its recoverable amount. The assets listed in the above tables were written down to their respective recoverable amounts and \2,486 million (U.S.$26,998 thousand) and \674 million of impairment losses were recognized in the statements of income for the years ended December 31, 2009 and 2008, respectively. The impairment loss consisted of \657 million (U.S.$7,139 thousand) for buildings and structures, \1,074 million (U.S.$11,665 thousand) for machinery and equipment, \63 million (U.S.$691 thousand) for other and \689 million (U.S.$7,480 thousand) for removal cost for the year ended December 31, 2009 and consisted of \311 million for buildings, \176 million for machinery and equipment, \78 million for other, \123 million for gain on sales of land, \121 million for loss on disposal of buildings and \110 million for removal cost for the year ended December 31, 2008. The impairment loss for idle assets was measured based on the selling prices and the memorandum value of the idle assets. 8. Loss on Discontinued Operations Loss on discontinued operations, amounting to \490 million (U.S.$5,324 thousand) for the year ended December 31, 2009, consisted of inventory valuation loss and its related disposal cost due to cease of operations of facilities for chlorinated organic products. 32 Annual Report 2009