ar2010 3 / 50
10秒後にBOOKのページに移動します
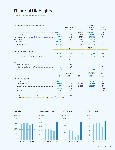
0 50,000 100,000 150,000 200,000 (Millions of yen) 06 07 08 09 10 155804 162729 162615 Net sales 0 5,000 10,000 15,000 25,000 20,000 (Millions of yen) 06 07 08 09 10 12950 12719 11668 Operating income 0 5,000 10,000 15,000 (Millions of yen) 06 07 08 09 10 6961 6403 1895 Net income 0 2 6 4 8 10 (Yen per share) 06 07 08 09 10 7.5 8 8 Cash dividends Toagosei Co., Ltd. and Consolidated Subsidiaries Financial Highlights Years ended December 31, 2010, 2009 and 2008 Millions of yen Thousands of U.S. dollars (Note 1) 10/09 2010 2009 2008 2010 Change (%) Net sales................................................................................................................ \153,779 \140,033 \162,615 $1,887,098 9.8 Operating income........................................................................................... 21,271 11,158 11,668 261,030 90.6 Income before income taxes and minority interests........................ 17,917 7,205 6,869 219,868 148.7 Net income.......................................................................................................... 13,133 3,541 1,895 161,164 270.9 Total assets.......................................................................................................... 173,847 161,609 172,464 2,133,361 7.6 Net worth (Note 2).......................................................................................... 110,283 99,449 99,271 1,353,331 10.9 Yen U.S. dollars (Note 1) Per share of common stock Net income................................................................................................. \52.05 \13.85 \7.27 $0.64 275.8 Cash dividends applicable to the year...................................... 9.00 6.00 8.00 0.11 50.0 % Ratio Return on equity (ROE)....................................................................... 12.5 3.6 1.9 . 247.2 Return on total assets (ROA)............................................................ 7.8 2.1 1.1 . 271.4 Net worth.................................................................................................... 63.4 61.5 57.6 . 3.1 Millions of yen Thousands of U.S. dollars (Note 1) 10/09 2010 2009 2008 2010 Change (%) Net sales by segment Commodity Chemicals....................................................................... \46,870 \45,646 \55,165 $575,174 2.7 Acrylic Products....................................................................................... 60,680 48,683 51,057 744,636 24.6 Specialty Chemicals.............................................................................. 16,970 15,607 24,380 208,257 8.7 Plastics........................................................................................................... 28,026 28,599 30,550 343,920 (2.0) Other Businesses..................................................................................... 1,231 1,497 1,460 15,110 (17.8) Notes 1: U.S. dollar amounts are translated from yen, for convenience only, at the rate of \81.49 = $1.00. 2: Net worth refers to the amount of net assets after deduction of minority interests. Toagosei Co., Ltd. 1