ar2013 49 / 56
10秒後にBOOKのページに移動します
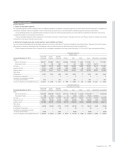
30. Segment Information Business Segments 1. Outline of reportable segments The reportable segments of the Company and its consolidated subsidiaries are defined as operating segments for which discrete financial information is available and reviewed by the Board of Directors regularly in order to make decisions about resources to be allocated to individual segments and assess performance. Group operating divisions are organized based on products and services and the operating divisions are responsible for comprehensive domestic and overseas comprehensive plans as to the products and services. The four reportable segments of the Company are “Commodity Chemicals,” “Acrylic Products,” “Specialty Chemicals,” and “Plastics” based on similarity of economic characteristics, and nature of products and services. 2. Method of calculating net sales, income and loss, assets, liabilities and others The accounting method applied to the reportable segments is the same as described in “Summary of Significant Accounting Policies.” Segment income of the reportable segments is based on operating income. Intersegment sales or transfer amounts are determined on the basis of market prices. Business segment information of the Company and its consolidated subsidiaries for the years ended December 31, 2013 and 2012 were summarized as follows: Reportable segments Millions of yen Year ended December 31, 2013 Commodity Chemicals Acrylic Products Specialty Chemicals Plastics Total Others Total Adjustments Consolidated Sales: Sales to third parties...................................................... \45,627 \59,069 \16,517 \26,463 \147,679 \ 3,402 \151,081 \ . \151,081 Intersegment sales......................................................... 35 106 480 3 627 7,583 8,211 (8,211) . Net sales...................................................................................... 45,663 59,176 16,998 26,467 148,306 10,986 159,293 (8,211) 151,081 Segment income................................................................... 3,374 6,274 3,290 1,349 14,289 88 14,377 123 14,501 Segment assets....................................................................... 35,980 55,413 17,025 36,645 145,063 1,922 146,986 46,099 193,086 Other items Depreciation............................................................................. 2,324 2,570 688 1,391 6,975 77 7,052 593 7,645 Amortization of goodwill................................................. . . 9 . 9 . 9 . 9 Investment in associates accounted for using equity method................................................ 678 . 169 . 847 . 847 . 847 Increase in tangible and intangible fixed assets.... \ 2,816 \ 2,100 \ 616 \ 908 \ 6,443 \ 165 \ 6,608 \ 1,031 \ 7,639 Reportable segments Thousands of U.S. dollars Year ended December 31, 2013 Commodity Chemicals Acrylic Products Specialty Chemicals Plastics Total Others Total Adjustments Consolidated Sales: Sales to third parties...................................................... $432,940 $560,489 $156,731 $251,102 $1,401,263 $ 32,284 $1,433,548 $ . $1,433,548 Intersegment sales......................................................... 338 1,015 4,562 37 5,954 71,961 77,915 (77,915) . Net sales...................................................................................... 433,279 561,504 161,294 251,139 1,407,217 104,245 1,511,463 (77,915) 1,433,548 Segment income................................................................... 32,021 59,533 31,226 12,807 135,589 835 136,425 1,169 137,594 Segment assets....................................................................... 341,402 525,791 161,542 347,710 1,376,447 18,242 1,394,690 437,422 1,832,113 Other items Depreciation............................................................................. 22,058 24,394 6,533 13,199 66,185 731 66,916 5,629 72,546 Amortization of goodwill................................................. . . 94 . 94 . 94 . 94 Investment in associates accounted for using equity method................................................ 6,435 . 1,607 . 8,043 . 8,043 . 8,043 Increase in tangible and intangible fixed assets.... $ 26,727 $ 19,934 $ 5,852 $ 8,621 $ 61,136 $ 1,568 $ 62,705 $ 9,785 $ 72,491 Toagosei Co., Ltd. 47